48°F

Aaron Parecki

  • Articles
  • Notes
  • Photos

#graphs

  • Dan Q https://danq.me/

    Heatmapping my Movements

    Portland, Oregon • 59°F
    #cartography #covid-19 #geography #graphs #houses #infographics #javascript #maps #moving #nostalgia #opensource
    Sun, Aug 22, 2021 12:50pm +01:00 (liked on Sun, Aug 22, 2021 7:29am -07:00)
  • [15/100] Today is the day! Get Your Money Together: An illustrated purrsonal finance workbook to help you budget your money, save for retirement, and smash debt came out to all backers. Happy tax day!
    .
    #100daysofqs #100dayproject  #the100dayproject #data #graphs #quantifiedself  #dataviz #books #publishing #goals #omg #purrsonalfinance .
    Colophon: Image created in Omnigraphsketcher.
    Portland, Oregon • 50°F
    #100daysofqs #100dayproject #the100dayproject #data #graphs #quantifiedself #dataviz #books #publishing #goals #omg #purrsonalfinance
    Wed, Apr 18, 2018 10:08am +09:00 (liked on Tue, Apr 17, 2018 8:04pm -07:00)
  • Lillian Karabaic http://anomalily.net/
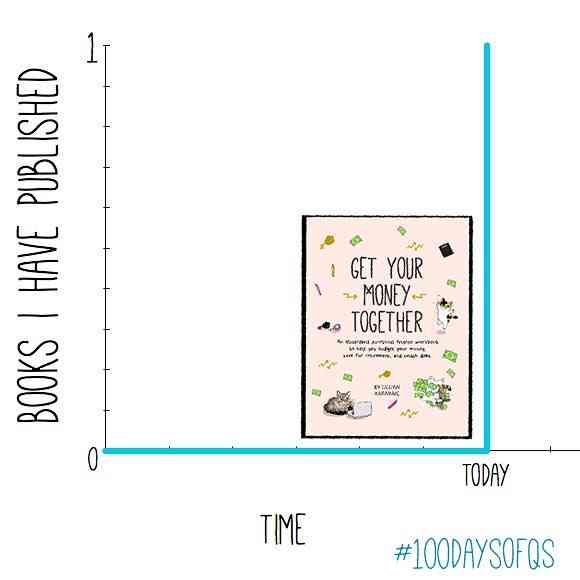
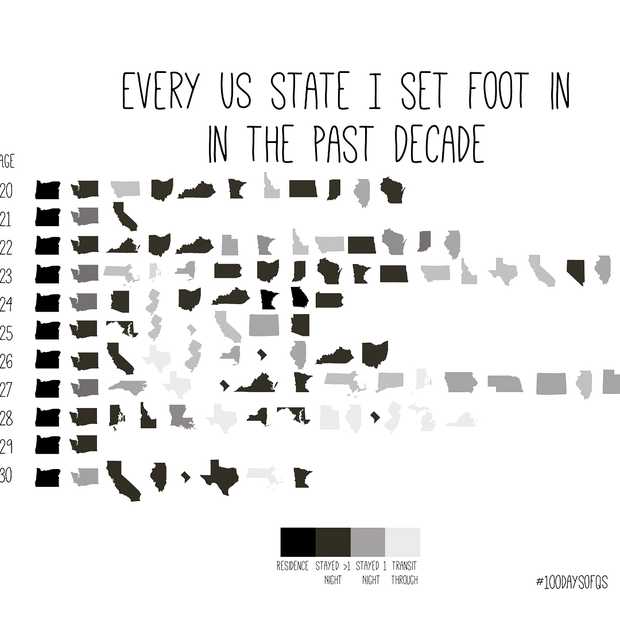
    Today I’m starting the #100dayproject - over the next 3.3 months, I’ll be creating a visual representation of the past decade of my #quantifiedself data. I usually make zines of my data as an “annual report” each year, but I’m overflowing with data that hasn’t made it into the zines. If you have anything you’d like to see, let me know. #100daysofQS
    .
    .
    Colophon: Data collected using Foursquare Swarm and Google Calendar. State outline images by Alexander Skowalsky from the noun project, used via Creative Commons license. .
    #quantifiedself #qs #dataviz #data #selfreport #graphs #charts #travel #usstates
    Portland, Oregon • 60°F
    thegreatdiscontent.com
    #100dayproject #quantifiedself #100daysofQS #quantifiedself #qs #dataviz #data #selfreport #graphs #charts #travel #usstates
    Tue, Apr 3, 2018 5:41pm +00:00 (liked on Wed, Apr 4, 2018 3:29pm -07:00)
  • Gentallela Alela! (demo.kimlabs.com)
    #graphs #charts #ui #resources
    Wed, Nov 18, 2015 2:54pm -08:00
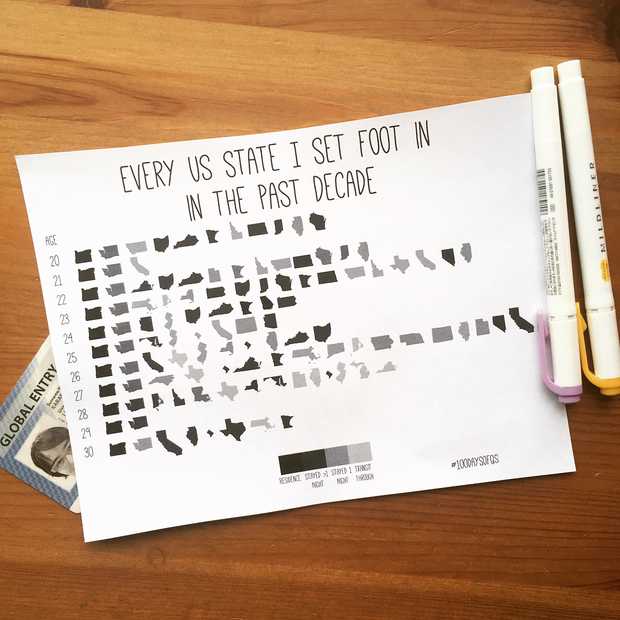
  • Introducing practical and robust anomaly detection in a time series | Twitter Blogs (blog.twitter.com)
    This package helps us monitor spikes in user engagement on the platform surrounding holidays, major sporting events or during breaking news.
    #bigdata #graphs #anomaly
    Thu, Jan 15, 2015 4:52pm -08:00
  • A JavaScript Charting Library for Streaming Data (smoothiecharts.org)
    #charts #graphs #javascript #library #resources #smoothiecharts
    Mon, Jan 27, 2014 9:36am -08:00
next

Hi, I'm Aaron Parecki, Senior Security Architect at Okta, and co-founder of IndieWebCamp. I maintain oauth.net, write and consult about OAuth, and participate in the OAuth Working Group at the IETF. I also help people learn about video production and livestreaming and dabble in product design.

I've been tracking my location since 2008 and I wrote 100 songs in 100 days. I've spoken at conferences around the world about owning your data, OAuth, quantified self, and explained why R is a vowel. Read more.

  • Security Architect at Okta
  • IndieWebCamp Founder
  • OAuth WG Member

  • 🎥 YouTube Tutorials and Reviews
  • 🏠 We're building a triplex!
  • ⭐️ Life Stack
  • ⚙️ Home Automation
  • All
  • Articles
  • Bookmarks
  • Notes
  • Photos
  • Replies
  • Reviews
  • Trips
  • Videos
  • Contact
© 1999-2023 by Aaron Parecki. Powered by p3k. This site supports Webmention.
Except where otherwise noted, text content on this site is licensed under a Creative Commons Attribution 3.0 License.
IndieWebCamp Microformats Webmention W3C HTML5 Creative Commons
WeChat ID
aaronpk_tv