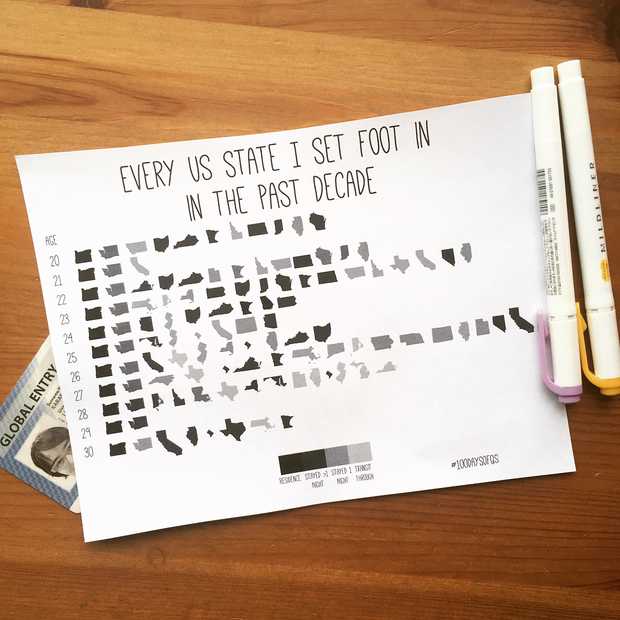
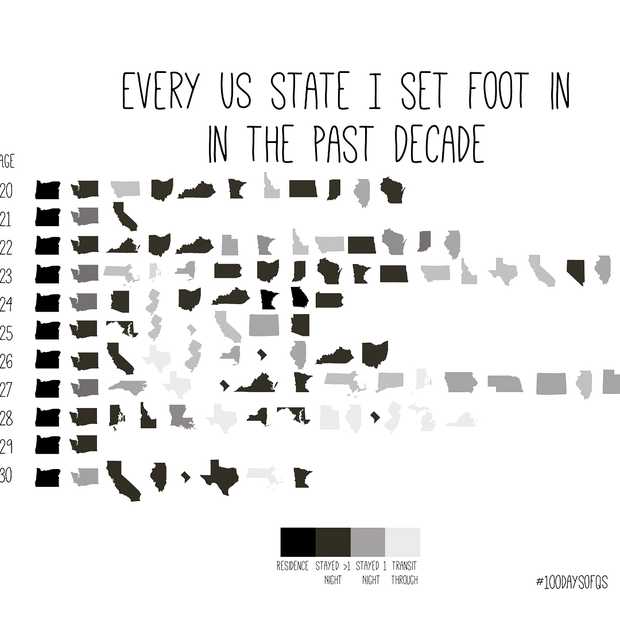
Today I’m starting the #100dayproject - over the next 3.3 months, I’ll be creating a visual representation of the past decade of my #quantifiedself data. I usually make zines of my data as an “annual report” each year, but I’m overflowing with data that hasn’t made it into the zines. If you have anything you’d like to see, let me know. #100daysofQS
.
.
Colophon: Data collected using Foursquare Swarm and Google Calendar. State outline images by Alexander Skowalsky from the noun project, used via Creative Commons license. .
#quantifiedself #qs #dataviz #data #selfreport #graphs #charts #travel #usstates
.
.
Colophon: Data collected using Foursquare Swarm and Google Calendar. State outline images by Alexander Skowalsky from the noun project, used via Creative Commons license. .
#quantifiedself #qs #dataviz #data #selfreport #graphs #charts #travel #usstates


