Have you ever wondered where in your city you spend the most money? This post will show you how to plot all your Simple transactions on a map! No code required!
Export your data as a CSV file
Log in to your Simple account and go to your dashboard. In the right hand column, change the view to "All Time".
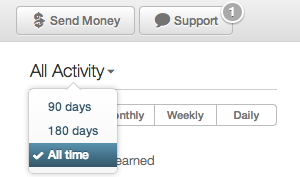
The view will update to show all your transactions. Then, click the "Export" button and choose "CSV".
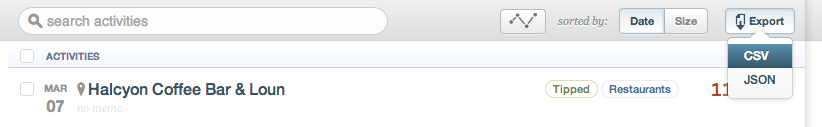
Save that file to your computer somewhere.
Creating a map
For this part, you'll need an ArcGIS Online account. You can get a 30-day free trial to try this out quickly.
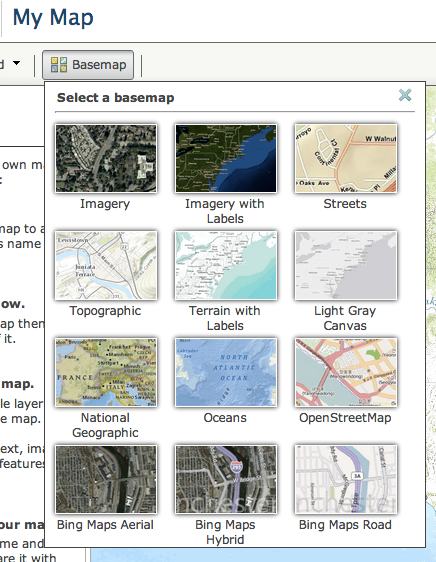
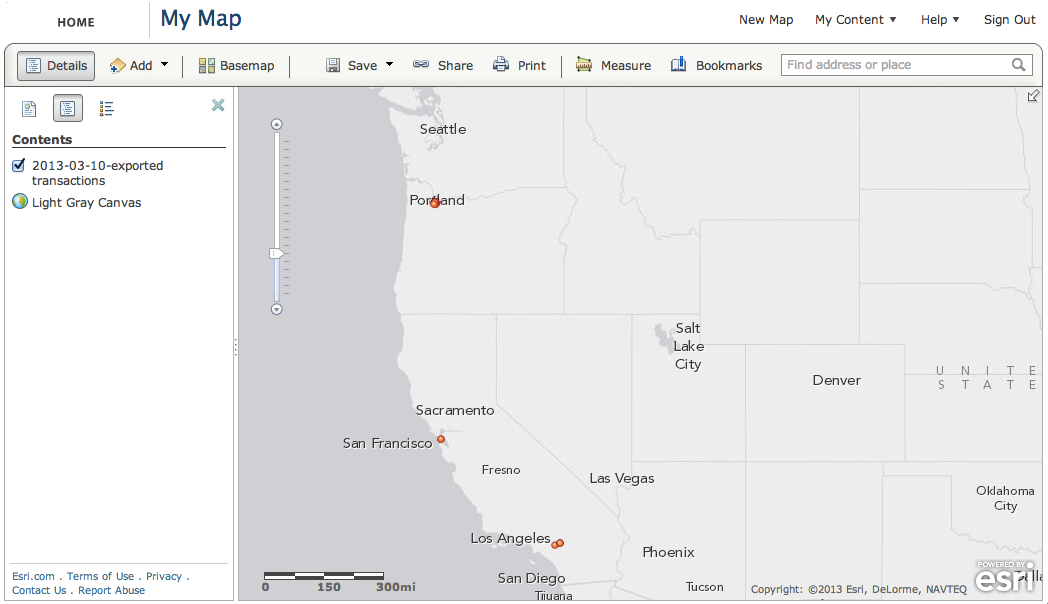
Once you log in, click the "Map" button at the top and you'll create a new blank map. You can choose one of the basemaps if you don't like the way the default one looks. In this example I chose the "Light Gray Canvas" map.
Now for the magic part. Find your CSV file, and drag it on to the map. Yes, really. ArcGIS will automatically figure out where the latitude/longitude columns are in the file!
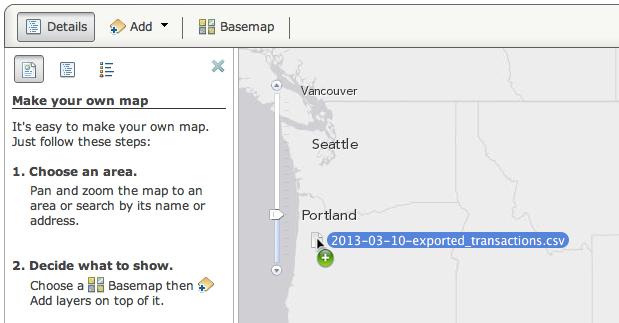
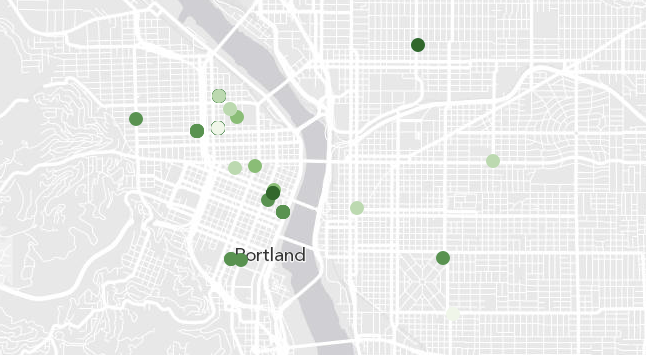
Now you'll see all your transactions on the map!
Customizing the Display
You'll notice that every transaction is using the default round orange marker. That's not terribly interesting. One of the really cool things we can do is change the markers depending on some variables in the dataset.
Using the "Change Symbols" option, you can select a column to use as the variable. In this case I chose "Amount". If you then choose "Natural Breaks", it will find five ranges based on your data and assign different colors to each.
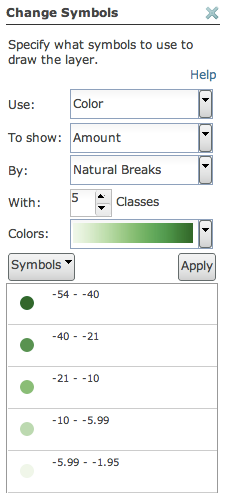
Now. when you look at the map, your transactions will be colored darker for larger transactions!
Feel free to try this on your own, or if you're interested, send me your CSV file (remove everything except the lat/lng and amount if you want to anonymize it a bit) and I can generate some images for you!